The Hyve recently added gene set scoring visualization to cBioPortal OncoPrint. To give you an example, we created our own instance that has the TCGA glioblastoma dataset loaded with gene sets identified by Roel Verhaak and colleagues. Using the scoring algorithm Gene Set Variation Analysis (GSVA), we calculated scores for the gene sets in Roel’s publication. By clustering samples, we are now able to identify the four different subtypes of glioblastoma.
Data preparation
For this example, we extracted the four gene sets identified by Verhaak et al. (2010)1 from the Molecular Signature Database (MSigDB). These gene sets can classify glioblastoma tumors in Proneural, Neural, Classical, and Mesenchymal subtypes. We used the RSEM normalized RNA-Seq expression data from the TCGA glioblastoma dataset, downloaded from cBioPortal Datahub, as our source data. Microarray expression data was also available, but using both datasets will probably lead to unwanted batch effects. Gene set scores were calculated using the R package GSVA (Hänzelmann et al., 2013)2, which is an non-parametric unsupervised method for estimating variation of gene set enrichment through the samples of an expression dataset.
Loading in cBioPortal
First, we prepared the cBioPortal database to contain all the gene sets we needed. In a recent update to the cBioPortal seed database, which also contains gene names and aliases, we added every gene set from MSigDB 6.1. This saves any future users from going through the trouble of adding these gene sets. Adding gene sets is actually not that hard. We documented how to do that, here.
Secondly, we added the GSVA scores to the GBM study from Datahub as well as a set of p-values per score. The GSVA algorithm itself does not calculate p-values, but these can be added using your own preferred method. For our test instance, we ran a permutation test with random gene sets of the same size.
Query in cBioPortal
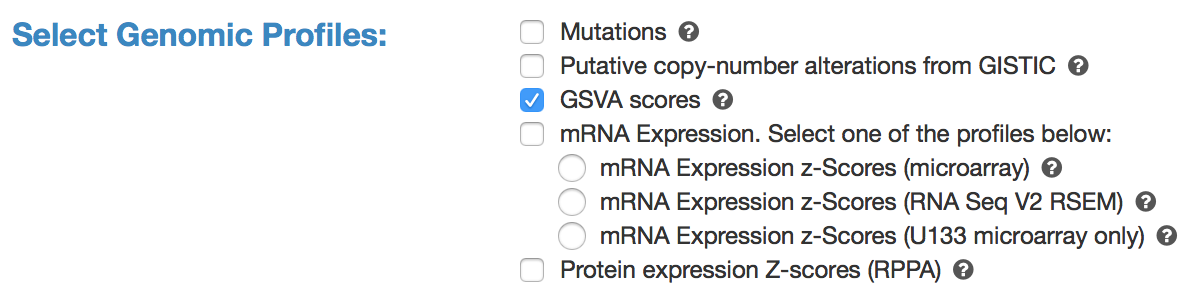
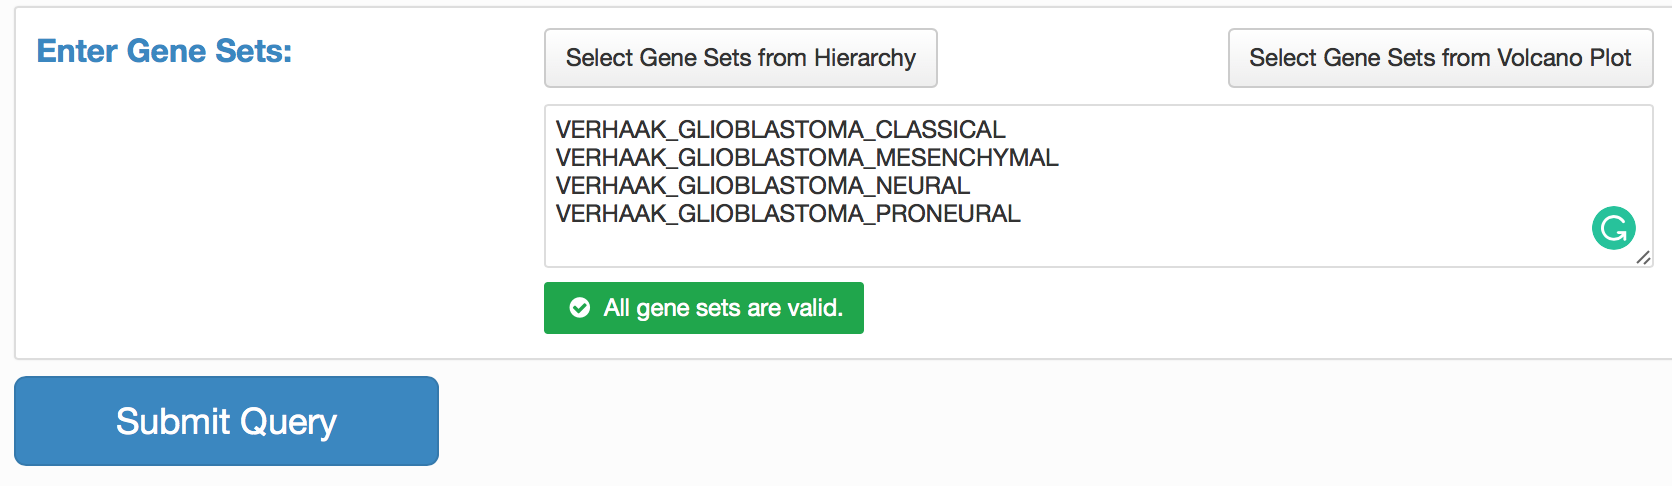
Using the new query page, it is possible to select the gene set scoring profile and query specific gene sets. These can be selected from a volcano plot, which is based on scores versus p-value, as well as a list that is hierarchically sorted. For this example, we manually entered them in the new “Enter Gene Sets” box, an option that appears after selecting the “GSVA scores” profile.
VERHAAK_GLIOBLASTOMA_CLASSICAL
VERHAAK_GLIOBLASTOMA_MESENCHYMAL
VERHAAK_GLIOBLASTOMA_NEURAL
VERHAAK_GLIOBLASTOMA_PRONEURAL
Example Query using 4 gene sets on the TCGA provisional dataset.
Results
By default, samples in cBioPortal OncoPrint are sorted based on genetic alterations. By clicking the ‘Heatmap button’, selecting the ‘GSVA Scores’ profile’ and clicking ‘Cluster Heatmap’, samples will be ordered to clustering. This shows that most samples can be classified as a particular subtype based on GSVA scores.

For support regarding loading gene set data in cBioPortal or any other questions on this feature or other projects we worked on, drop us a message.
References
1) Integrated Genomic Analysis Identifies Clinically Relevant Subtypes of Glioblastoma Characterized by Abnormalities in PDGFRA, IDH1, EGFR, and NF1
Roel G.W.Verhaak et al., Cancer Cell, 2010
https://www.sciencedirect.com/science/article/pii/S1535610809004322
2) GSVA: gene set variation analysis for microarray and RNA-Seq data
Sonja Hänzelmann, Robert Castelo and Justin Guinney, BMC Bioinformatics, 2013
http://bmcbioinformatics.biomedcentral.com/articles/10.1186/1471-2105-14-7
http://www.bioconductor.org/packages/release/bioc/html/GSVA.html


