Set your artificial intelligence and data strategy up for success

It is becoming increasingly clear that AI solutions can only work effectively when fed with good quality data. The real challenges lie currently more in the data area rather than in the analysis area (see e.g. this Forbes article that explains how ‘AI first’ implies ‘data first’, or how Mons and colleagues from GO-FAIR now propose to name FAIR data ‘AI ready’ data).
One hot data-related topic is knowledge representation and reasoning (sometimes referred to as ‘knowledge management’), which is commonly considered a field of artificial intelligence. A particular application of this field currently very popular with our customers is building a knowledge graph. In this post, I want to highlight some of the practical aspects of building knowledge bases and graphs. I’ll focus specifically on the choice of tooling.
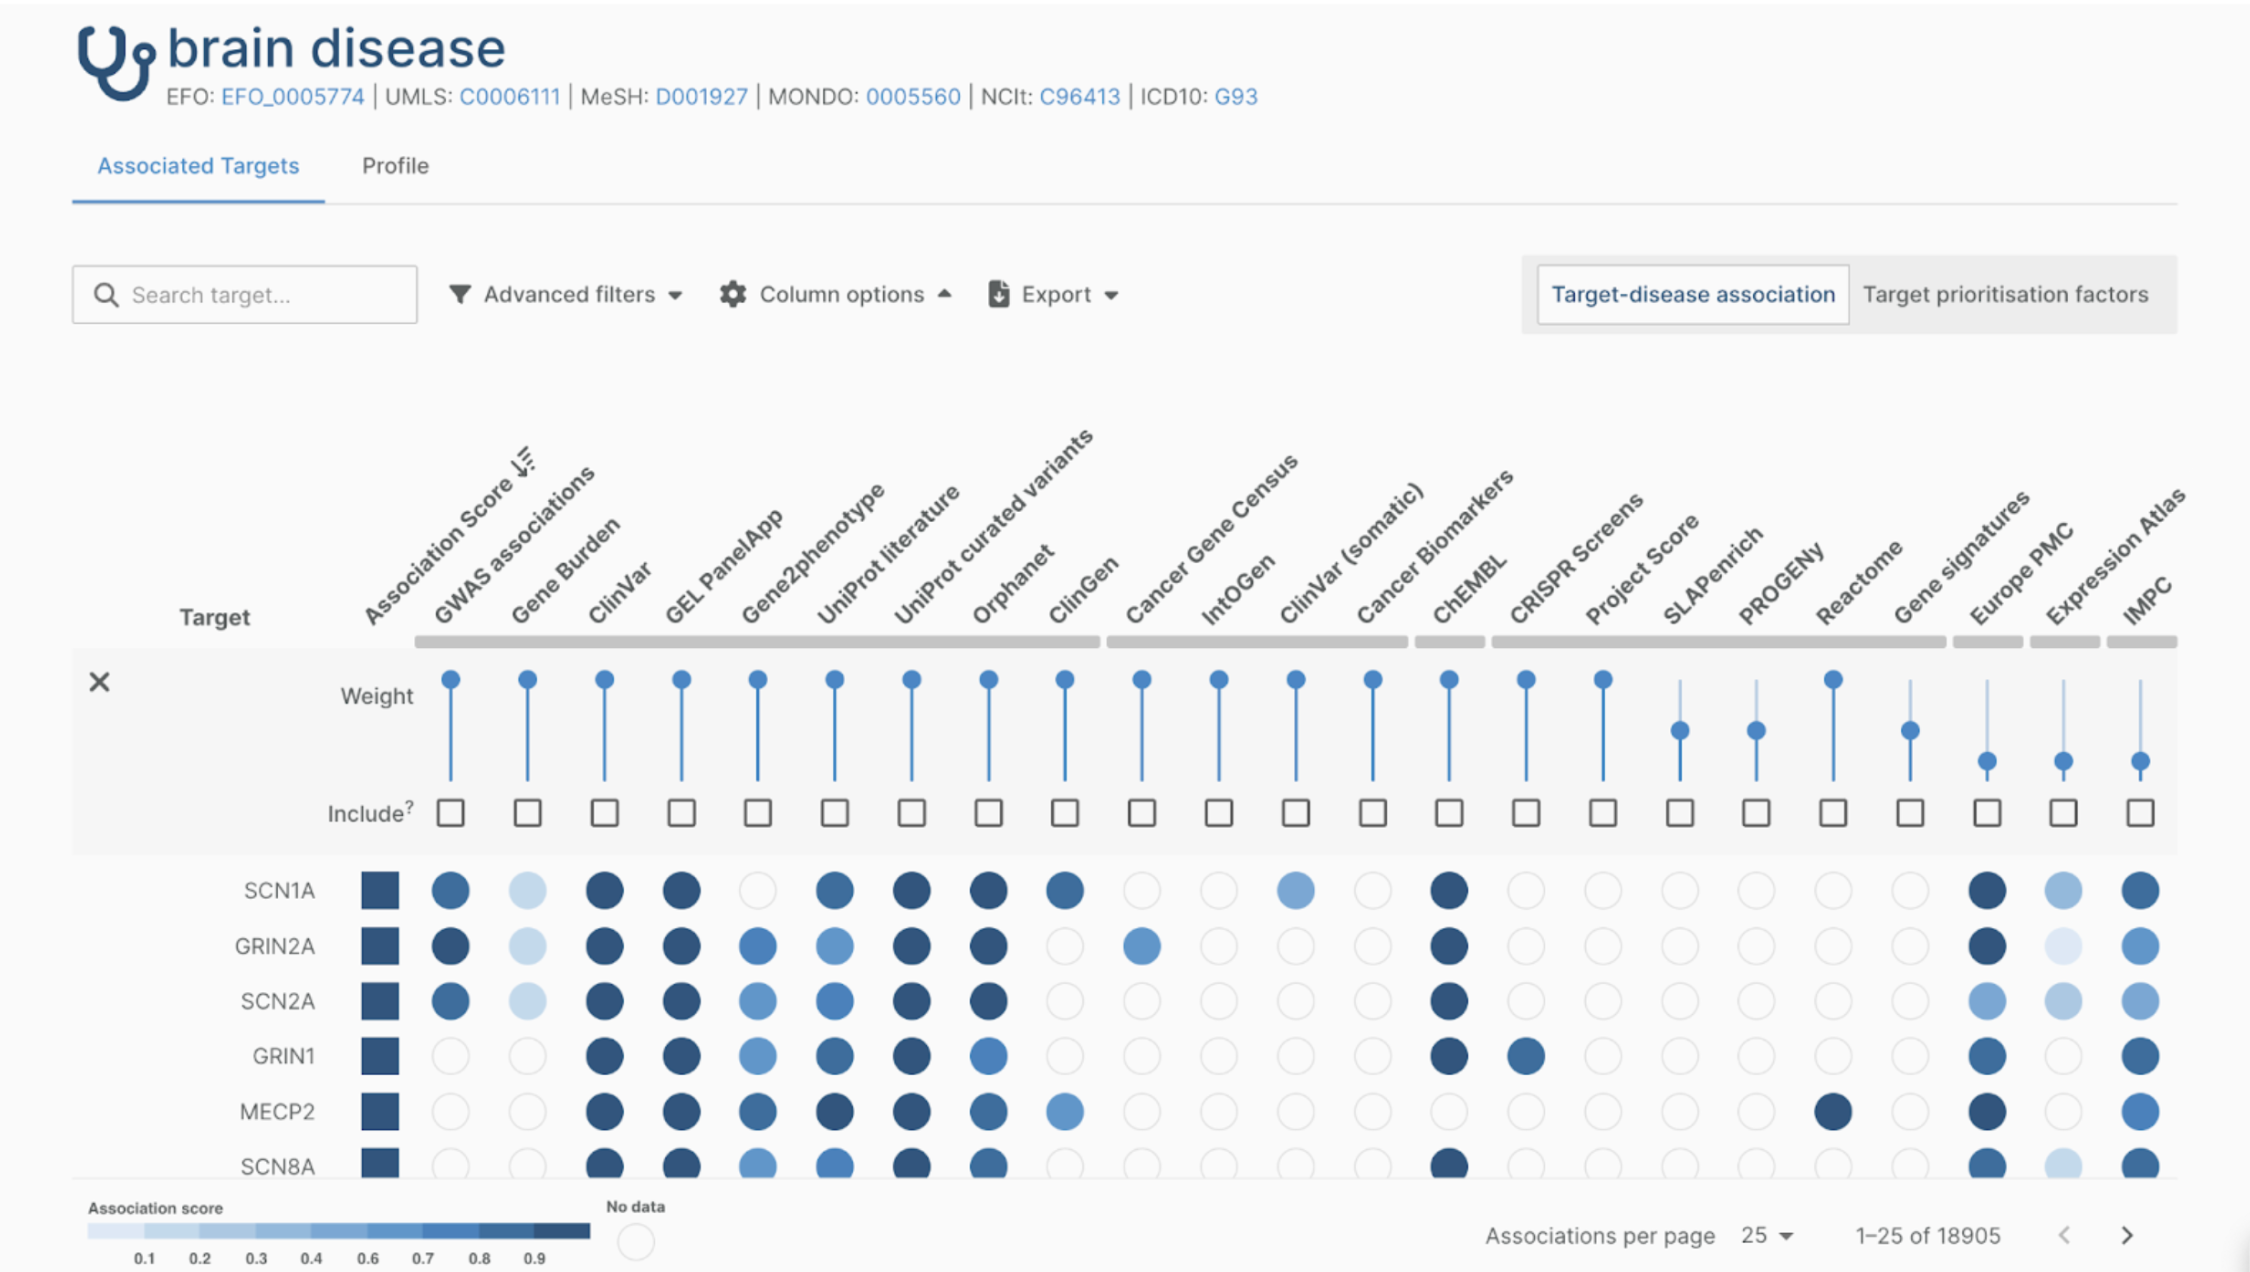
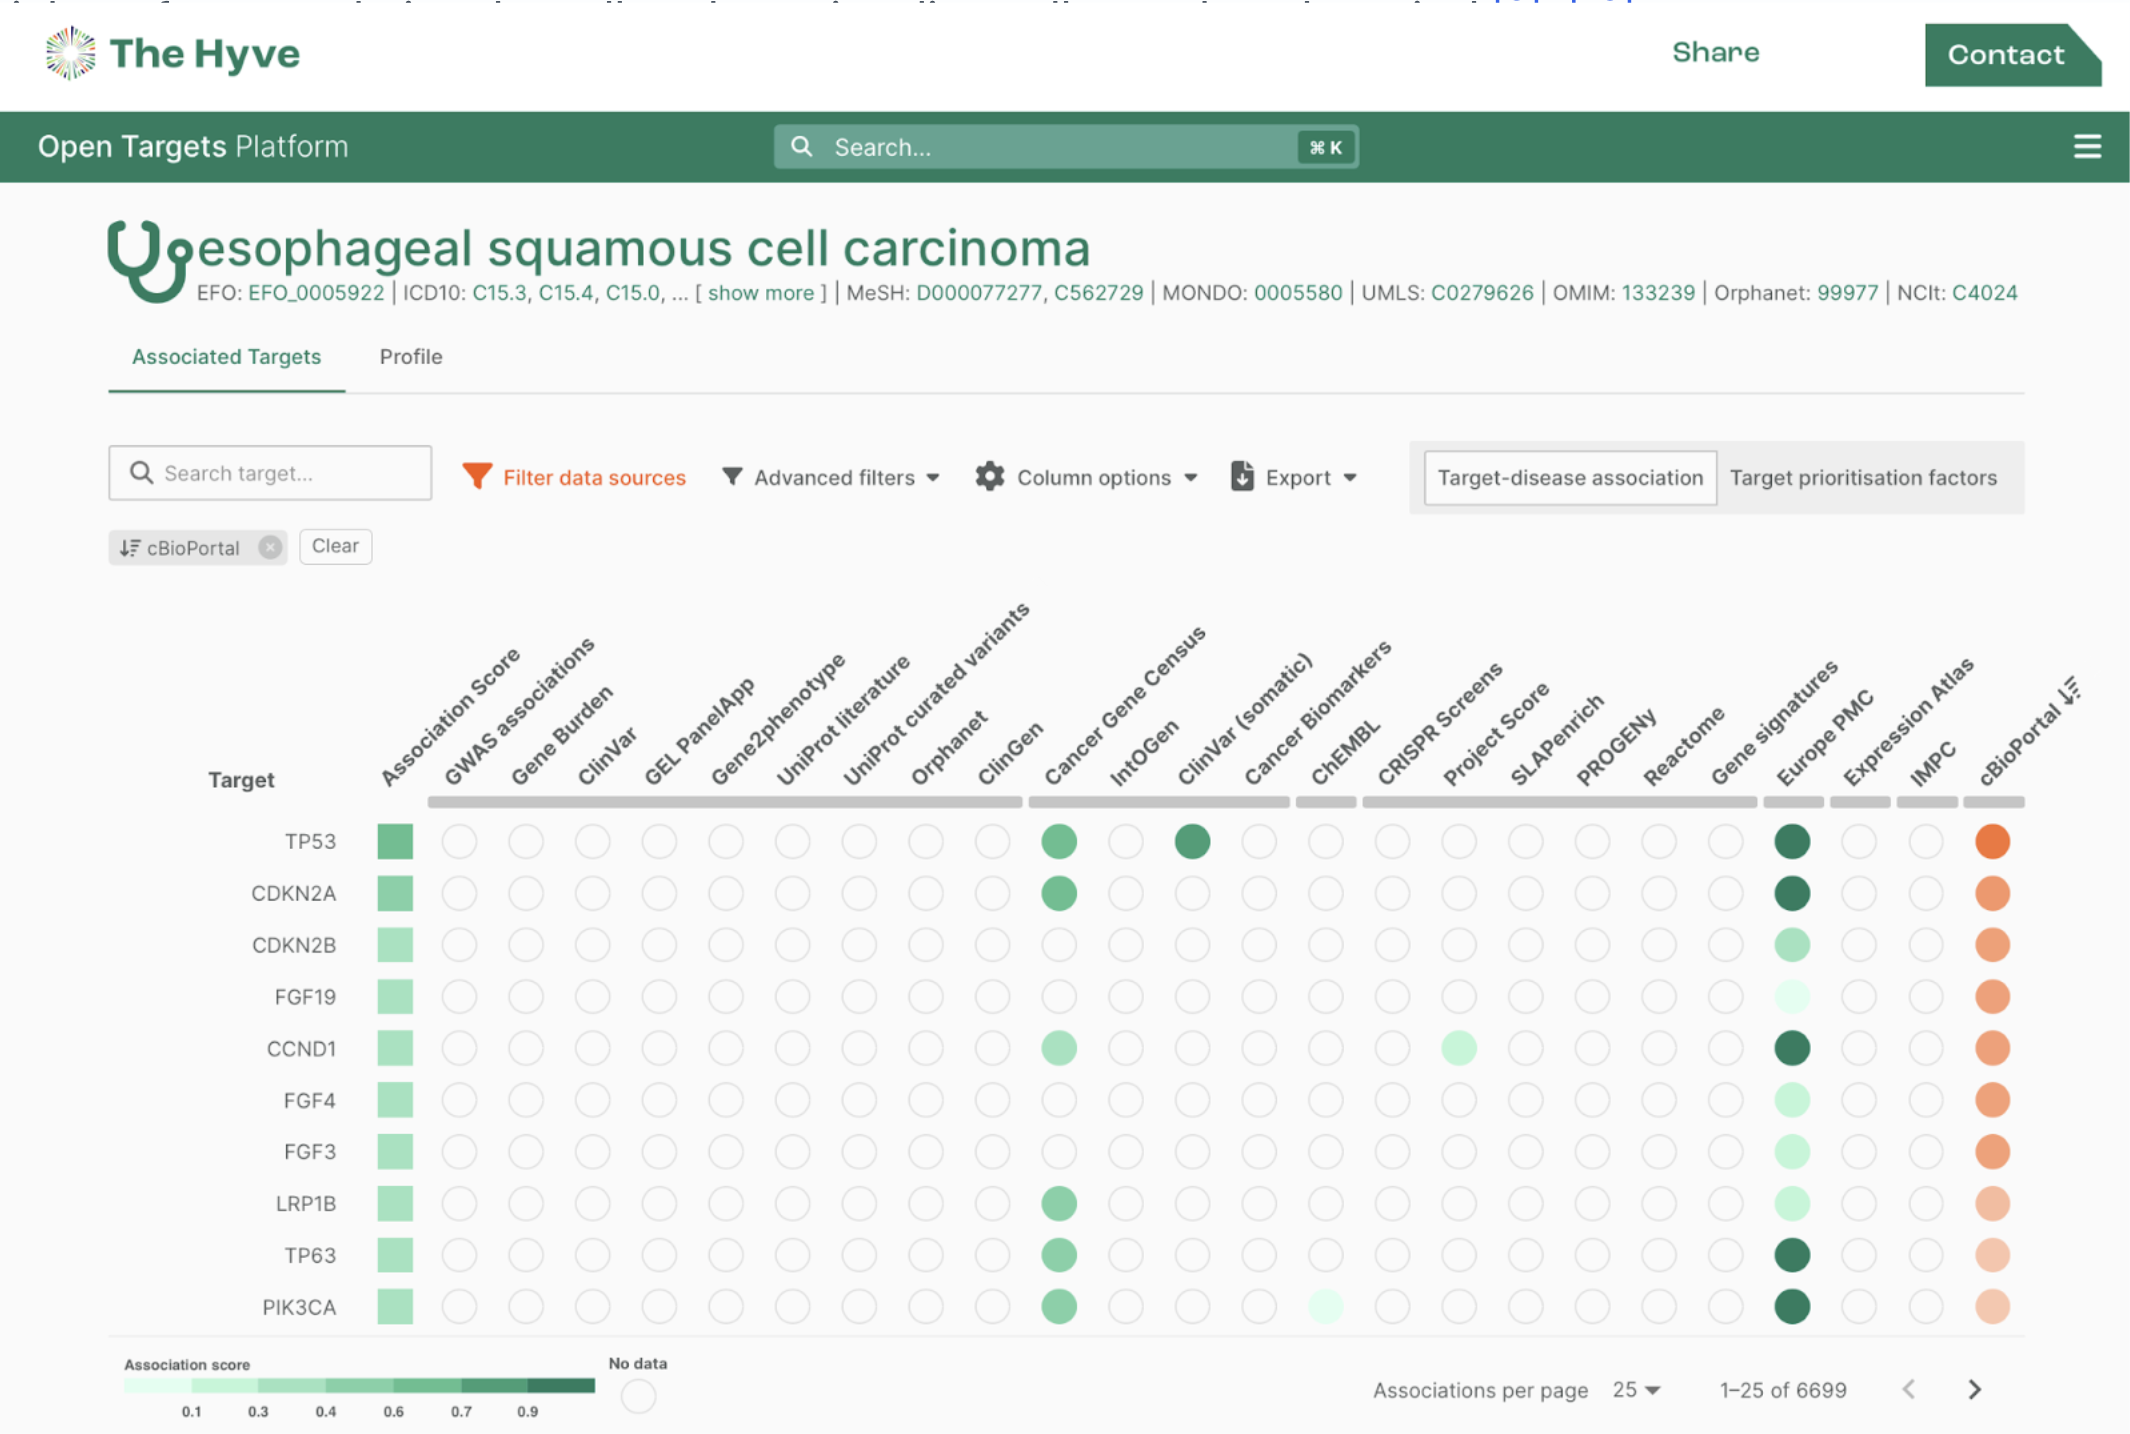
A knowledge graph is a collection of interlinked facts on a specified range of topics. These topic ranges can vary widely, for example, Wikidata is a graph that attempts to model all facts stated in Wikipedia as a graph. The Google Knowledge Graph and Diffbot are most likely the largest knowledge graphs in existence, and they attempt to model amand link all structured information found on the internet (on persons, organizations, skills, events, products, etc.). It’s what makes the Google search product so powerful and popular. In drug discovery, an example would be OpenTargets, one of the open-source products The Hyve supports. The knowledge graph defines entities (in OpenTargets: genes, diseases, drugs, trials etc.), their relationships (e.g. is target of, is associated with), and attempts to create an exhaustive collection of all instances of those entities (in OpenTargets: all human genes, registered drugs, clinical trials, etc.) and their relationships.

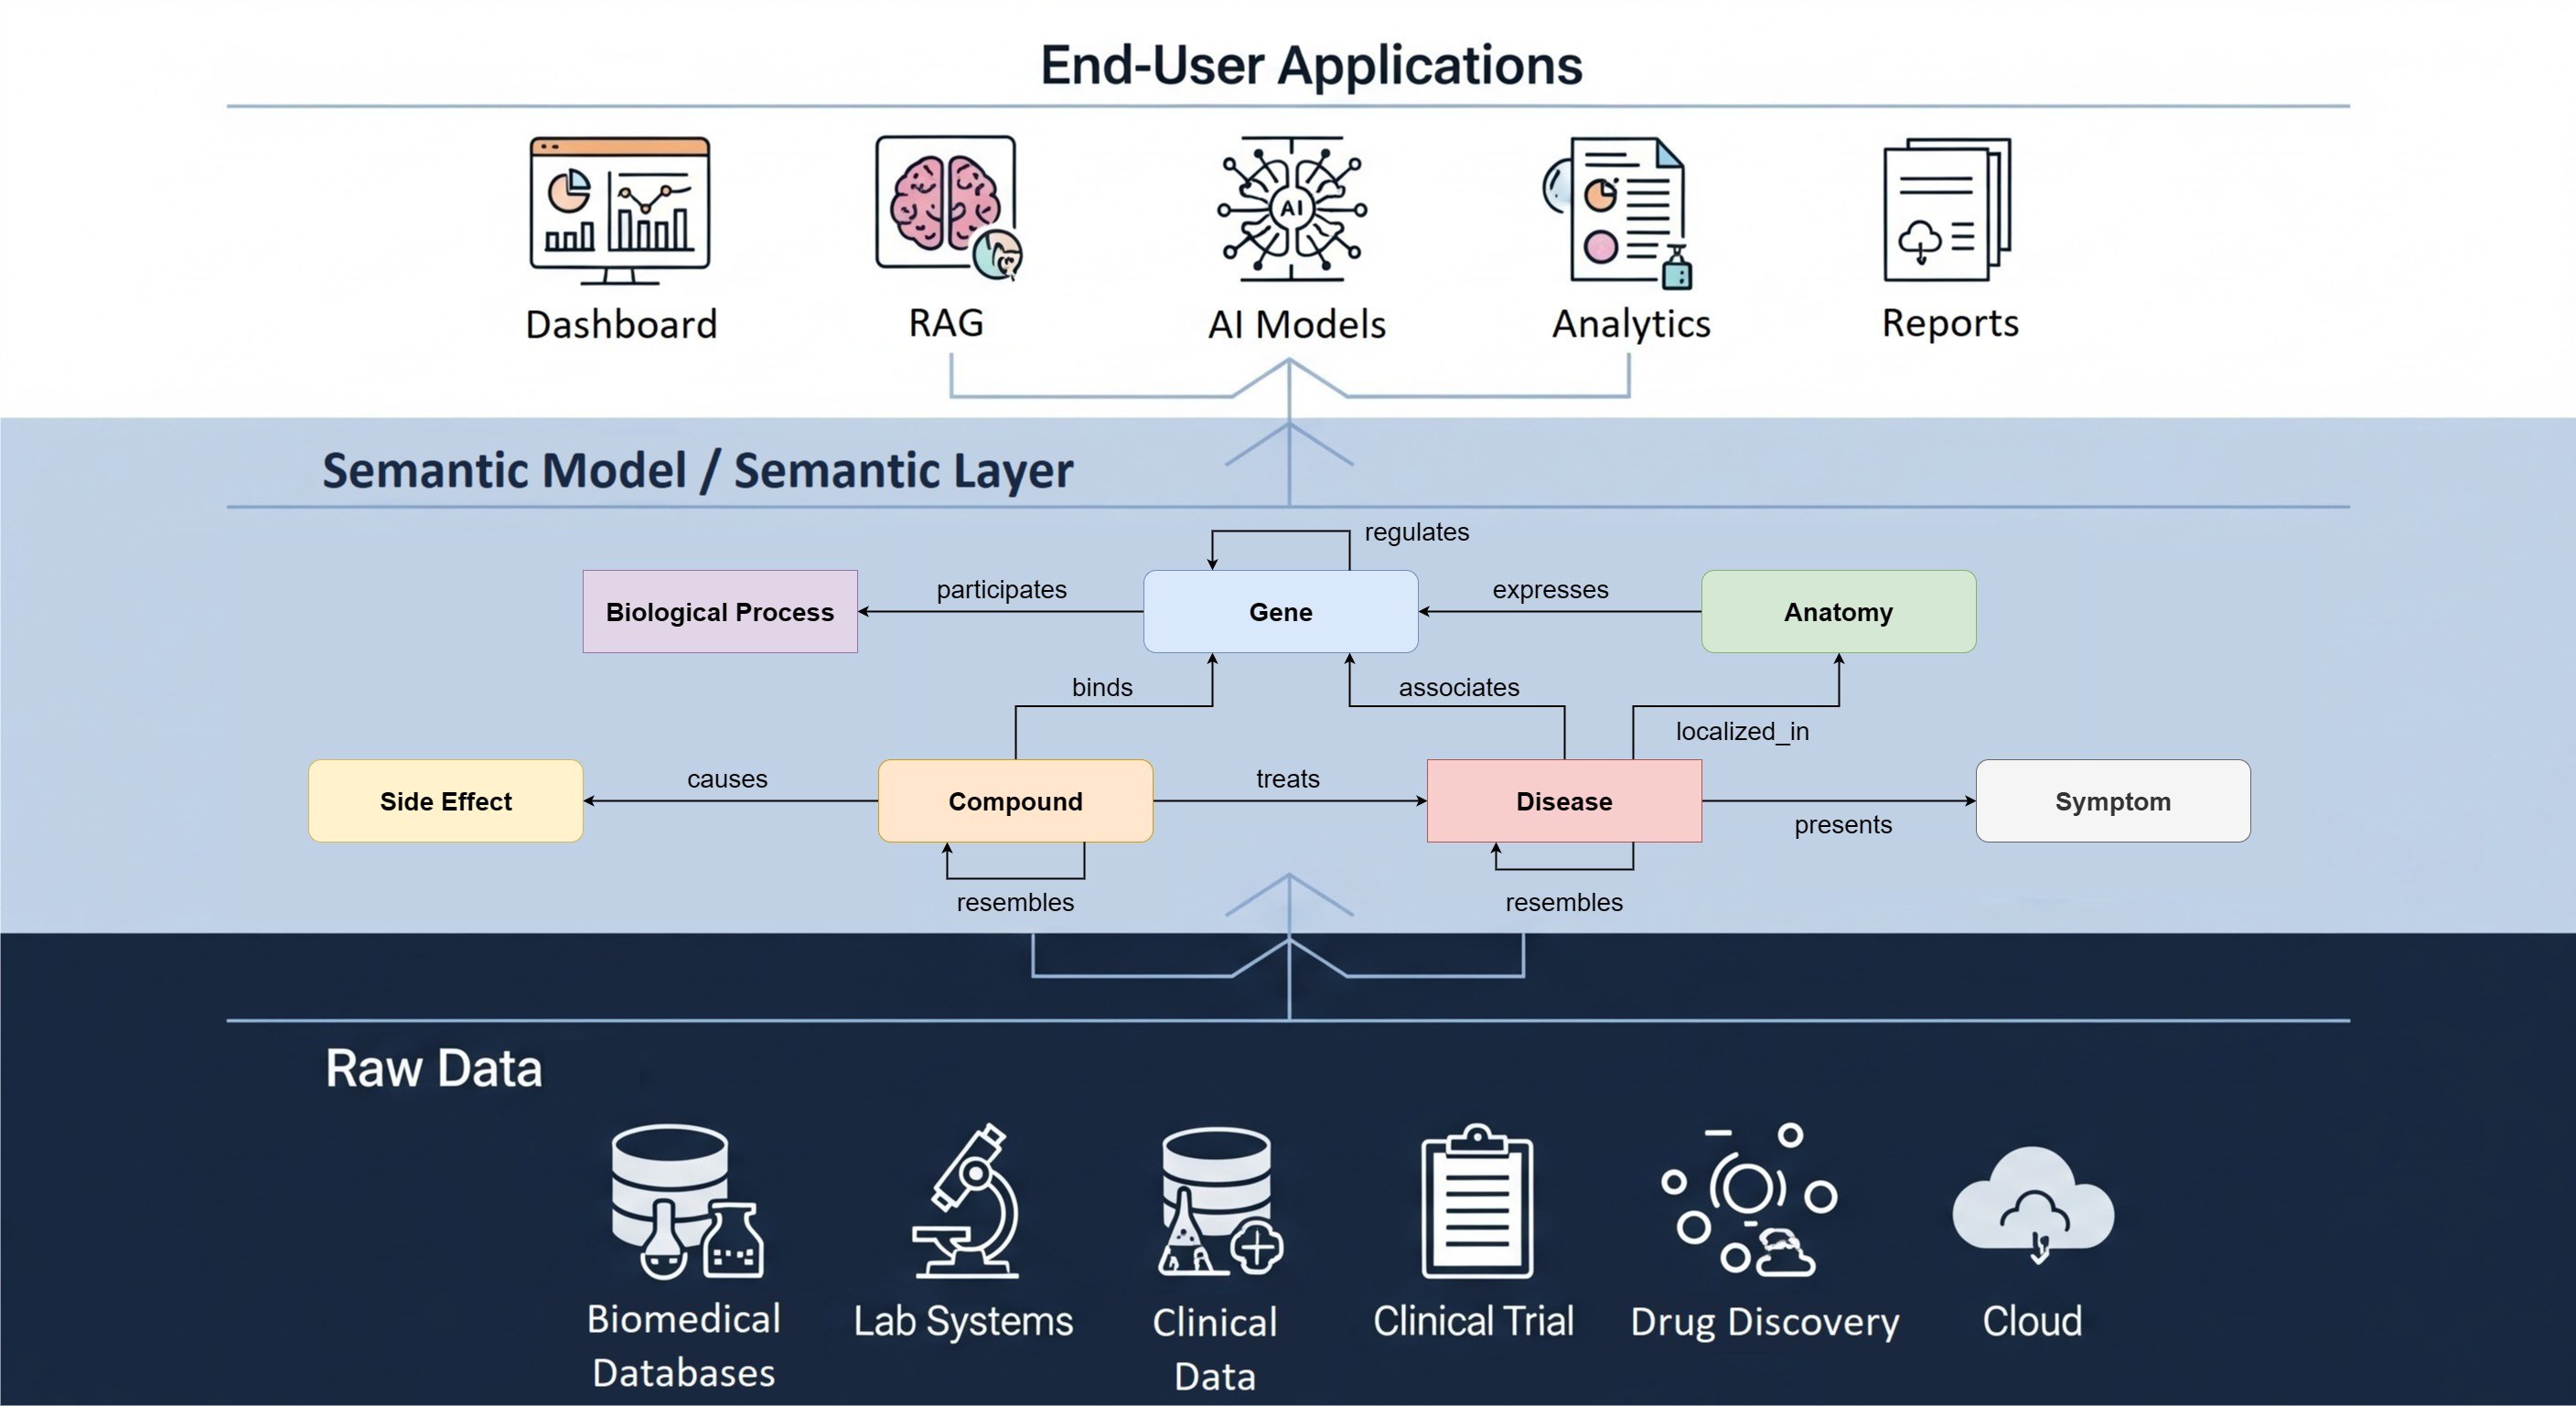
Let’s consider some generalized use cases based on a number of projects that The Hyve recently executed. Let’s say that a pharmaceutical company or an academic hospital wants to use existing internal and external data to speed up their core processes of drug discovery & development and translational medicine respectively. There is often plenty of raw data available from research systems such as LIMS and ELNs, clinical studies and trials, portfolio and project management systems, etc. But linking and integrating these data requires domain knowledge of chemistry, biology and medicine, and their many sub-disciplines such as clinical chemistry, molecular biology, pharmacoepidemiology. To tackle this problem at scale, data engineers at The Hyve use the FAIR principles, designing semantic models that make the context of datasets explicit and use these models to build knowledge graphs that address a specific knowledge space, such as a systems biology view on the drug discovery pipeline of a company.
Building a huge knowledge graph that contains all the data of a company, a hospital or a research institution, is too big a task to take on. An impressive knowledge graph such as Wikidata took years to build and still scratches only the surface of human knowledge. Therefore, the real challenge is how to build these graphs in a multi-phased way. This requires a smart approach to requirements engineering and stakeholder management. But that’s for another post – today, we zoom in on the different types of data engineering tools you need to make this happen. There are at least five distinct tool categories to distinguish.

Data Discovery Toolkit
Instead of rushing right into building the model or the graph, it can really pay off to first use a data discovery toolkit. Such a toolkit allows you to scan raw data sources at scale to get extracts and fingerprints of the sources, which allow you to quickly inspect what the main data entities are in your data sources and also to get a sense of the scale by getting statistics - like row counts. Dedicated toolkits for this are for example Amundsen from Lyft, Metatron Discovery. You can also use Business Intelligence-derived tools such as Apache Superset or small tools like OHDSI White Rabbit. However, this scan requires direct physical access to the data sources and we found that even with permission from executive management, this is hard to organize at scale in a large company due to security and compliance rules. The next best option then is to get data extracts and build a mini-model detailing the provenance of the extracts supplied by system owners. In any case, it helps to first describe your sources systematically, and you’ll benefit from this throughout the project!
Model Repository
An obvious second key activity is semantic modelling: defining the entities and relationships in scope of the knowledge graph. You will need to select a model repository that allows you to build and manage multiple semantic models. A tool like WebProtege is built for this purpose. You can also use enterprise tools such as TopBraid Composer. However, a simple git repository with the model files in OWL/RDF Turtle format is the basis and may even suffice. It turns out that a text editor like Visual Studio Code is very usable for editing purposes, and since modellers are often technical people anyway this may be enough! It is also advisable to build a shapes library, using e.g. SHACL. At The Hyve we are building a tool called Fairspace which helps both defining the models as well as validating and applying them to metadata. Note that the Linked Data stack is not the only technology that can provide semantics. There are many alternatives for defining data models and validations/constraints, such as OntoUML, using archetypes, or simply JSON schema to cite a few extremes.
Knowledge Base
Thirdly, you will need a repository to store and maintain the knowledge base itself. When using Linked Data tooling, it’s common to use a triple store for this, such as Jena, RDF4J, Allegrograph, etc. But of course you can also opt for a graph database instead, such as Neo4J, or use one of the enterprise solutions that offers an all-in-one approach such as Ontoforce’s DISQOVER or TopBraid’s EDG if the company has licenses for those. You could even use a private instance of Wikibase: the open-source stack behind Wikidata. Or you can leverage dedicated data science stacks such as Dataiku, Palantir, Informatica, SAS/JMP, Marklogic, etc. At The Hyve, we don’t limit ourselves to a particular tool stack, but work with the technology the company has already chosen or built themselves. There’s no shortage of tools and stacks for data manipulation, the harder part is understanding the use cases for and semantics of your data, which is what we at The Hyve focus on.

Data Mapping Framework
Crucially, with the data sources described, the model built and the knowledge graph repository ready for action, you will now need to actually populate the knowledge graph with data (or assertions, as semantic modellers call it: they distinguish between the T-box (the model: entities and relationships) and the A-Box (statements conforming to this model). In order to get this done, you can use a data mapping framework, that allows you to incrementally start to annotate the raw data as scanned from files and databases with semantic annotations using models from the model repository. Once the source data are mapped to entities and relationships defined in the model, you can write the resulting statements to one or more knowledge graphs. Additionally, if you have defined data shapes or validation rules as well as your model, you can use those to validate the output and check the sanity of the input data. Smart usage of validation logs can help uncover a ton of business-relevant information, such as what the status of identifier usage is across the company or whether labels and terms are applied consistently.
There are many possible technology choices for describing and executing this mapping. A Linked Data example documented in this Wikimedia project is proposing LinkedPipes, but you can also use existing, established big-data frameworks for ETL/ELT, workflow orchestration, and stream processing, such as Singer/Stitch, Airflow, Samza, Storm, Flink, Meltano etc. However, the problem with using any framework is that while it helps to get started, it often ends up limiting you. When you are spending a lot of your time working around the design ideas of an existing framework, you know it’s time you write your own! I have seen this happen quite often and it’s because there are so many nuances to data engineering. Every data engineering project is unique, and the bottleneck can be in any of these components. So rather than recommending one tool, I’ll state some high level requirements, starting with interfaces to the above 3 tools: the framework should be able access the data scans, leverage the semantic model, and write to the knowledge graph repository. It should also generate logs of data validation issues or mapping errors, which are often very insightful for either updating the model or pre-processing the raw data further where needed. Building a knowledge graph is typically an iterative process: it is unlikely that you get the model right on the first try, you often discover additional data sources over time, and the querying and visualization of the knowledge graph often gives rise to additional questions and input for the model and the mapping rules.
Data Visualization Framework

Which brings us to the last technology choice topic: you need a data visualization framework that allows you to rapidly build queries and visualizations of the data in the knowledge graphs. Of course, if you use Linked Data tools you can run SPARQL queries, but many of your business stakeholders won’t be able or willing to learn how to use those. Typical data visualizations such as bar charts and heatmaps are also not so useful for graph data. An as-is graph visualization of the query results (for example using Gruff from Allegrograph) is often still too abstract to navigate through them. These query visualizations only show the basics: nodes, edges, and colors for the nodes and edges are shown. In order to encode more information visually, tools like Gephi, Cytoscape or ReGraph use node size, edge weight, layout and grouping as additional data to optimize the clarity of the data visualization. Layered visualizations such as nested bubble plots can help to convey the results in a visually informative way.


