Systematic assessment of how an organisation creates, receives, processes and disseminates data
Widespread digitalisation and emerging technologies have created an increasingly big gap between the growth of volume of data generation and the data consumption by consumers and interactors. This discrepancy is especially felt by executives and enterprises. They generate data to support the business decisions and strategies. However, most companies do not yet leverage the full potential of their data to base decisions on. To become a fully data-driven organization, it takes more than just great technology and quality data. It requires the right internal processes and culture – the harmony of technology acceptance and usage between the employees and the executives alike. Data guides business decisions and a data strategy helps to ensure that data is actually driving decisions. Failure of this leads to a trustless and incoherent environment where data is misused and exploited by the management and employees alike to match their hypothesis and decisions, which can be a very costly affair in the long run with sometimes zero exposure.

From time to time, we observe a misalignment between the company culture, the processes – even though an enterprise might have an immense data collection – and core expertise for the support. This essentially is an outcome of data non-findability and non-discoverability, along with not embracing modern data infrastructure principles and disregarding compliant data models to support decision-making. Several examples of this scenario are:
- different departments generate identical data because of findability and alignment issues,
- business employees make decisions without proper or based on incomplete data,
- high-level overview is completely absent at the enterprise level because of hundreds of isolated and legacy systems,
- partly transformed systems and custom tools and scripts are used/in use which are never accounted for.
A data landscape exploration aims to reveal these misalignments, data discoverability issues and technical conundrums. A data landscape is the representation of an organization’s data assets, storage options, systems for creating, analysing, processing and storing data, and other applications present in an enterprise’s data environment. This information can be illustrated dynamically and systematically by a semantic representation. It is visualised as a knowledge graph which is a collection of interlinked descriptions on a specified knowledge domain consisting of entities and their relationships, interfaces and data flows. Entities which are data asset components perform data-related functions. They range from data-warehouses, relational databases and scientific software – such as Electronic Lab Notebooks usually referred to as e-Lab Notebooks or simply ELNs (with brands like SmartBook, PerkinElmer, Benchling) and LIMS (Laboratory Information Management Systems) – to omics analysis tools with internal or public databases – such as the ones hosted at EBI and NIH. Several tools exist for building knowledge graphs as outlined in Data engineering tools for building knowledge graphs.

A well-structured data landscape helps answer contextual questions like:
- Which lab or department is working on condition X?
- How many and which internal data assets are related to compound Y?
- Do we have any tools to analyse raw RNA-Seq data?
- Where can I store my processed sequence data? Do we have a datastore and which one is used by which group?
- How can I visualise my protein network? Do we have an in-house tool or do I need to contract an external company?
- I am new to this software, where can I find more info about it?

The first step in data landscaping is inventorizing the applications which generate, operate, consume, process, store and archive data. The next step is inventorizing the data itself. The Hyve can execute both steps as part of our Data Landscaping service. For this service we gather information on all the data sources (databases, data warehouses, data lakes) within the organisation, all systems (research, clinical, commercial, etc.), data types, and also the actual data extracts and data dumps. These components are then scored, ranked and mapped to a semantic model. This model is populated and visualized in the form of a knowledge graph so that company executives can answer questions like:
- Where is my data?
- Which department is using the Q-Tof Mass spectrometer?
- Where can I find all the raw sequencing files from the X CRISPR construct?
- Which clinical trials are linked to the PD-L1 gene?
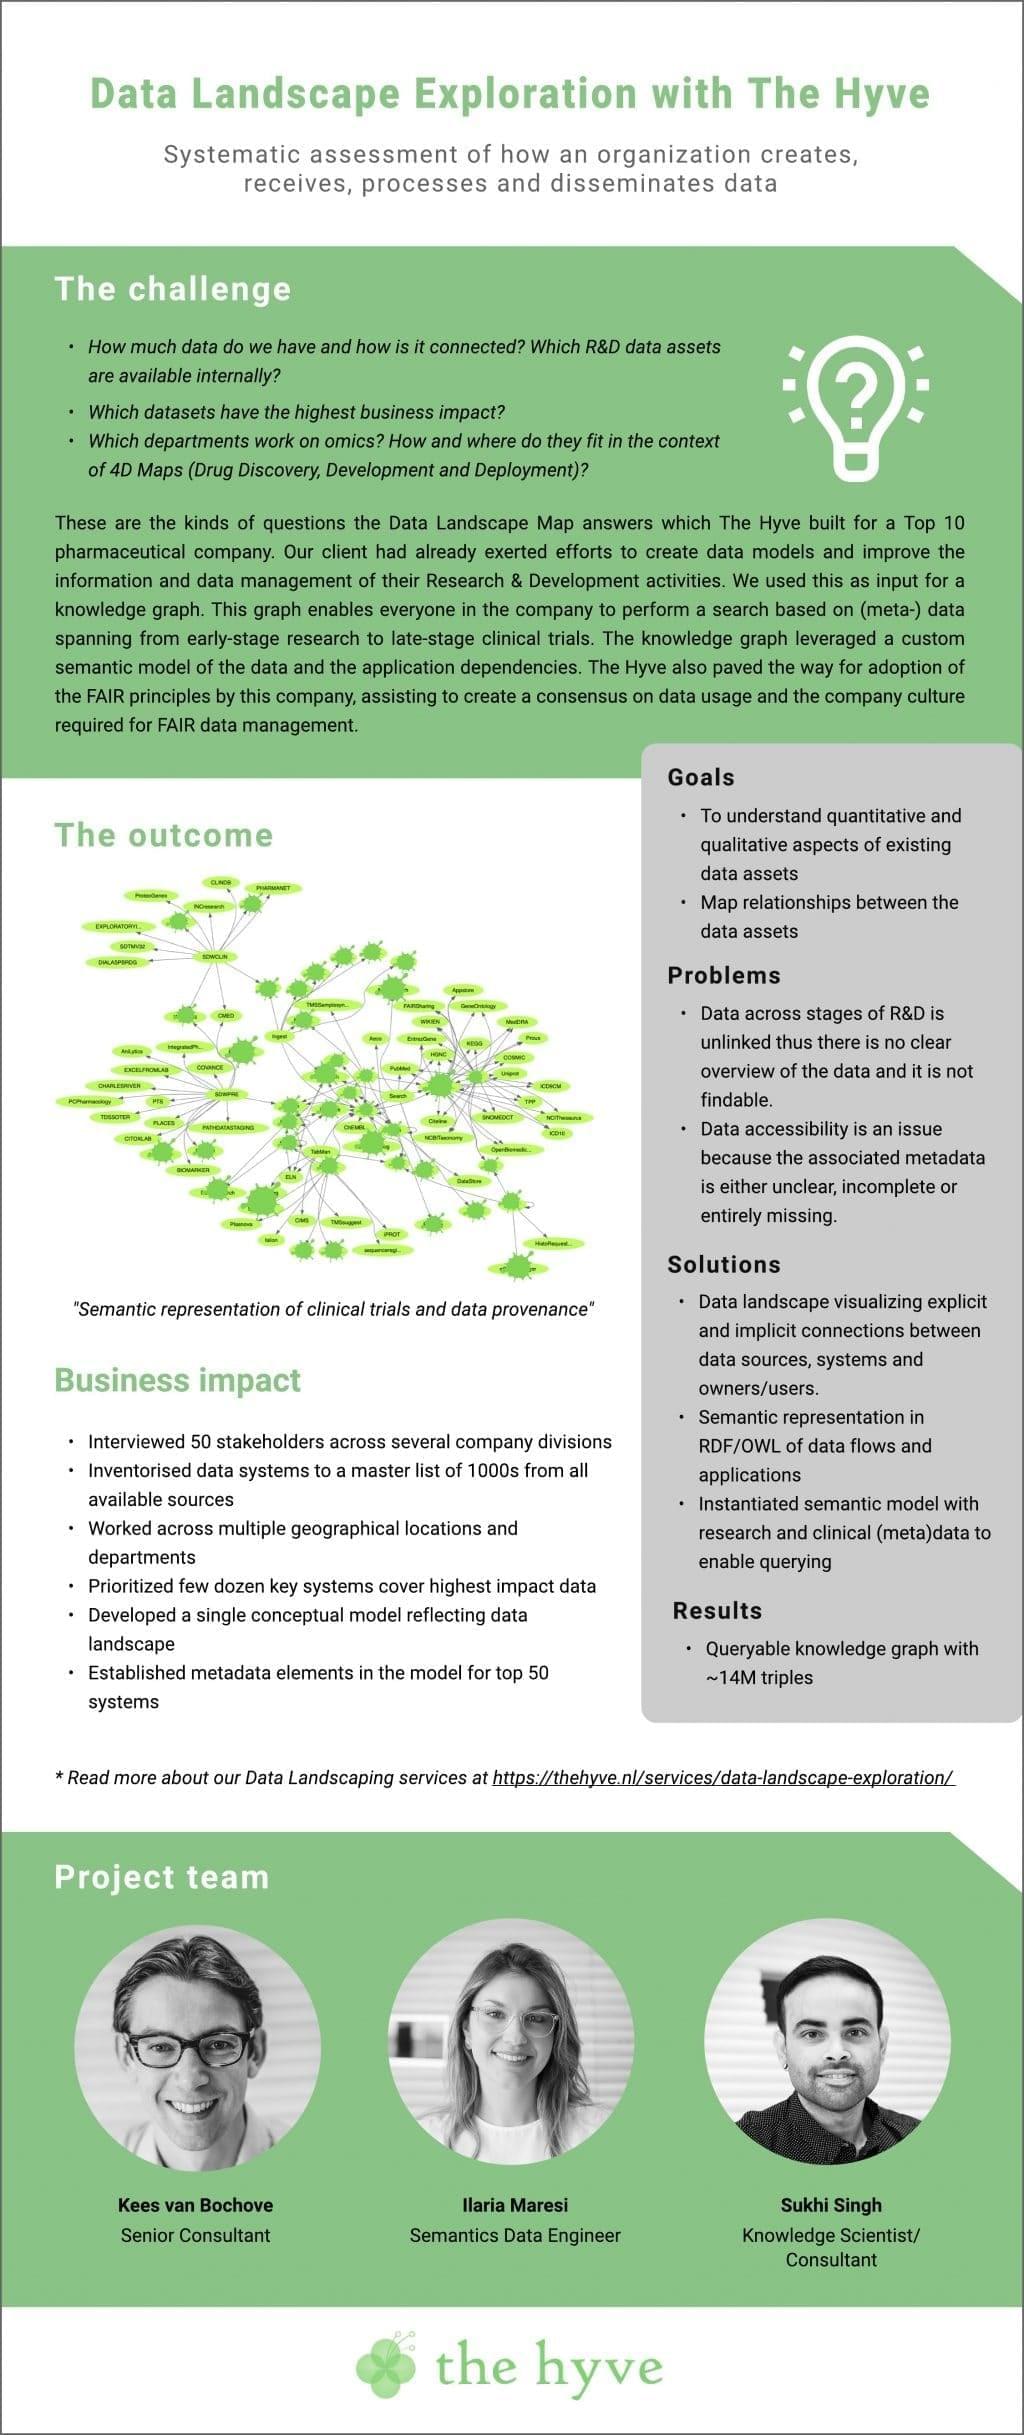
The flyer below is an example of a use case we executed for a Top 10 pharma client which resulted in a knowledge graph. It is consulted regularly to answer questions from research and business departments alike. We inventorized and ranked data systems from a master list of thousands of sources, narrowed these down to a few dozen key systems covering the highest impact data and developed a single conceptual model of the data landscape. The Hyve collected the information for data landscaping on visits to multiple sites and departments, interviewing about 50 stakeholders working in a range of pharmaceutical divisions.
Further reading:
- For more about the types of tools to build knowledge graphs, please read Data engineering tools for building knowledge graphs.
- For more about the potential impact of the data landscape and how it relates to the FAIR principles, please read Fair data governance is like a fractal


